SCII Homepage
canvasIsHere
multipleDatabase
dashboard

Try Canvas Online


Canvas Features


Product | SCII

Connect to any Database


Easy to Setup


Easy to Use


Excel Friendly


Security

Connect to any Database

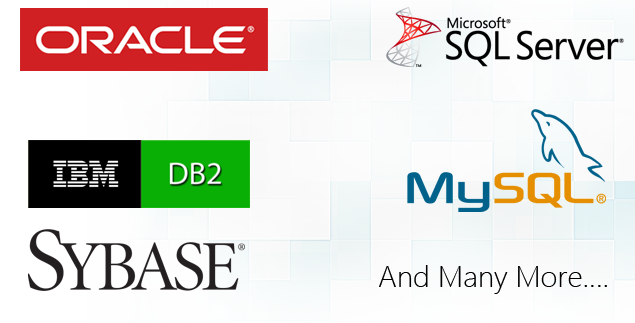
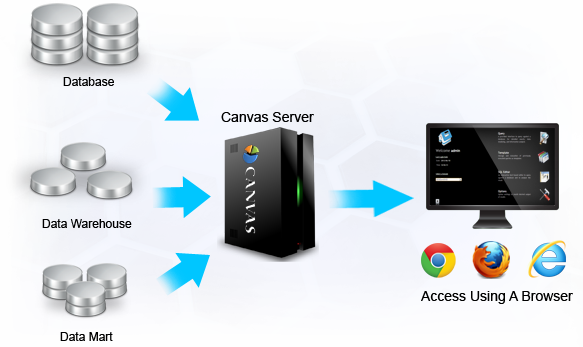
Canvas can connect to any Data Warehouse, Data Mart or any other database containing business data. Canvas supports Oracle, DB2, Sybase, SQL Server and MySQL databases.

  • Canvas connects to any database containing business data, be it a Data Warehouse, Data Mart or any other database.
  • Canvas adapts to your existing database structure - there is no need for any changes in your current structure.
  • An admin sets the control for each database object accessed by the user and hence ensures the security of information shared.
  • Domains, having the information of database connections and settings, can be used by the user after they are created by the admin.
  • Connect to many databases and get the data in one report (Excel file).

Easy to Setup

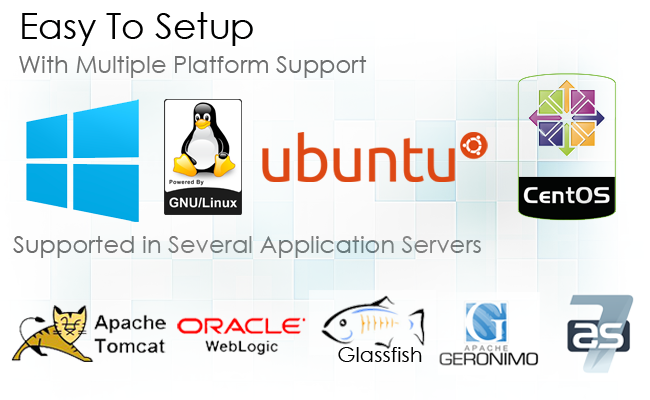
Canvas is an Enterprise Java Web application, and a pure Java implementation that can be installed and configured on various application servers on any Operating System with Java EE Virtual machine environment. This gives the advantage of installing the software on your existing software infrastructure instead of investing on the new one.

  • Setup and configure Canvas in any environment easily.
  • Works well on Windows and Linux.
  • Tested on application servers like WebLogic, Tomcat, JBoss, Glass Fish etc., on Oracle Java and JRockit JVMs.

Easy to Use

Canvas is an easy-to-use, yet powerful Business Intelligence tool which can be used by an average user. Business users can search data from the database even without the knowledge of SQL. With a short learning curve, users can set up templates, catalogs and dashboards for frequent access of analytical information.

  • Smart business intelligence software that is designed for users, who would like to use BI tools, without any technical competency.
  • Empowers the user to analyze the output without any database expert's interventions.
  • Provides user friendly and easily understandable data analysis features like pivot analysis, cross tabulation and totalize data.
  • Facilitates every manager, business developer, controller and marketing employee to access the company’s database and make own queries.

Excel Friendly

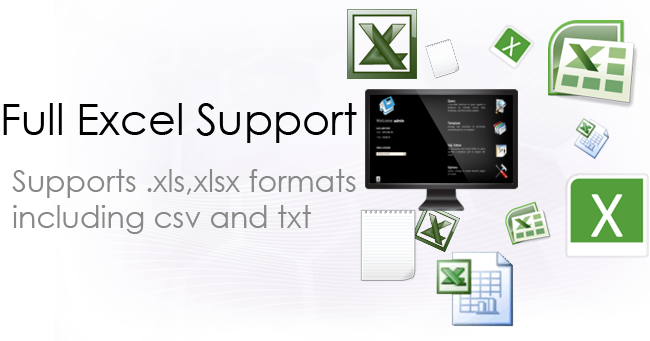
Canvas provides option to preformat Excel files, which are the most widely used business file format, to get the desired reports.

  • Even if canvas utilizes the data analysis capabilities of Excel, there is no need to install Microsoft Excel component in the server for the Canvas web application.
  • Provides a familiar Excel interface for data addition, analysis and reporting, making it easier for existing Excel users.
  • Compatible with Excel features to make the data analysis more intuitive and self-explanatory.
  • Pivot Analysis (pivot chart and pivot table).
  • Auto-Filter and Auto-Fit, Sorting, Subtotals etc., are also supported.
  • Data can be extracted and downloaded into Excel and CSV files.
  • Excel Macros can be used to automate analysis process.
  • Supports Excel 2003 format and the formats later than 2007.

Dashboard In Excel


Multiple Table Data in Excel


Security

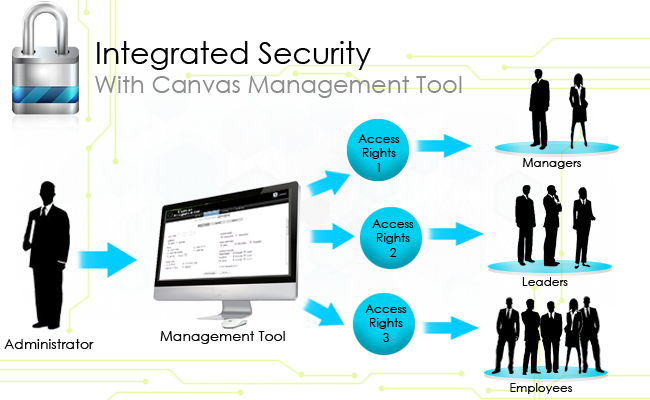
Canvas is designed to protect huge amounts of data and analysis assets in your organisation using powerful access control management functions that also tracks the action of each user.

  • Admin controls the access of the data that is assessed by each user.
  • Tracks activities of the users including login, logout and access to the domain database.
  • Controls the degree of safety through password policy maintenance mechanism.
  • Allow access to particular domains at pre-determined schedules.


Canvas Functionalities


Product | SCII

Query Builder


SQL Editor


Templates & Catalogue


Data Analysis


Canvas Dashboard

Query Builder

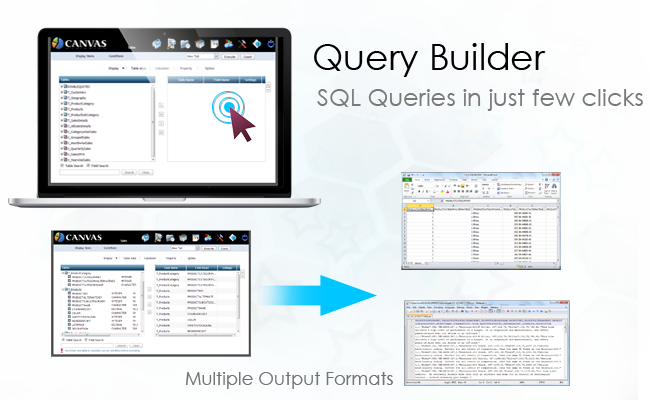
Query Builder is a powerful component in Canvas that helps you generate queries with just a few clicks. It allows to search for required data from relevant tables easily without writing tedious SQL commands.

  • Powerful graphical user interface enables the user to build SQL queries without the need of coding SQL manually.
  • Search and filter database objects, select objects and columns, create relationships between objects, view formatted query results.
  • No technical knowledge of SQL required.
  • Export any query result to Excel, CSV, Text or New window.

Query Builder

SQL Editor

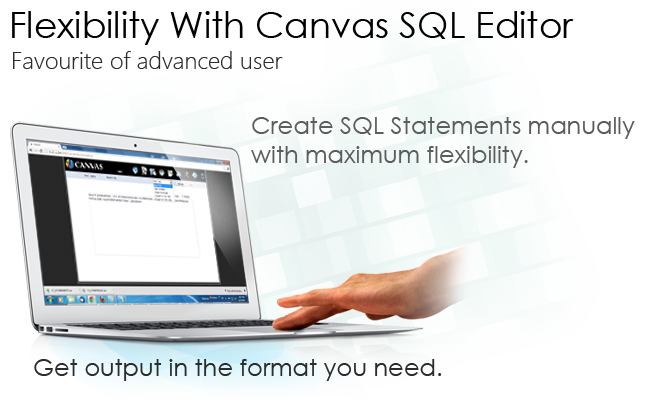
SQL Editor allows you to manually write SQL Queries thus providing full control to the query writer. This is the most favourite functionality of Canvas of for advanced users who wants full control on what they do.

  • Execute search and update on data with SQL Editor.
  • Supports ANSI SQL and database specific syntaxes.
  • It allows you to write, edit, execute, and reuse SQL statements.
  • Cut, copy, paste SQL and export the query results with ease.
  • Supports DML Statements.
  • Support for transaction with commit and rollback options for DML.
  • Get the output in New tab, Window, Excel, CSV or Text formats.
  • View and execute the recently executed SQL Queries.
  • The History option in canvas stores the previously executed queries for future reference.

SQL Editor


History

Templates & Catalogue

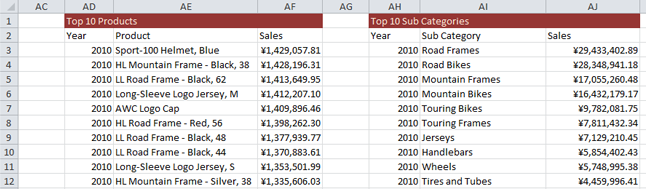
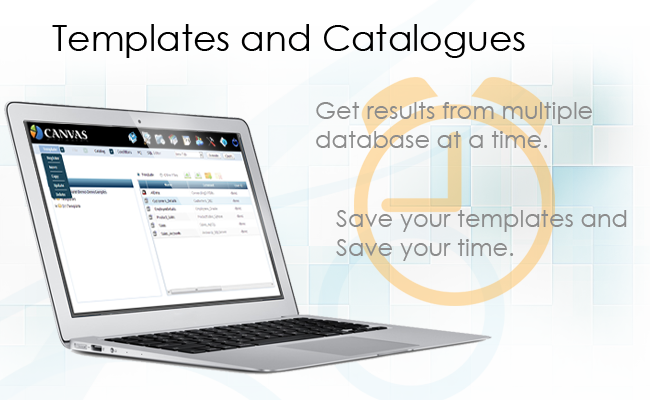
Data search done using Query Builder or SQL Editor can be saved as Templates for reusing them. Result of a query can be directed to a pre-formatted Excel workbook to get customized report instantly.

  • Multiple templates can be executed at a time by saving the template collection as Catalogs and results can be directed to one or more Excel workbooks.
  • Save the queries as Templates and execute anytime.
  • Set pre-formatted Excel file as target output and get reports instantly.
  • Use analysis functions of Excel (like Pivot table, charts) by redirecting data to pre-formatted Excel files.
  • Get dynamic results by passing values for parameters set in the templates.
  • Use Catalogs to batch process the templates and get data in same or different Excel files.

Templates and Catlogue

Data Analysis

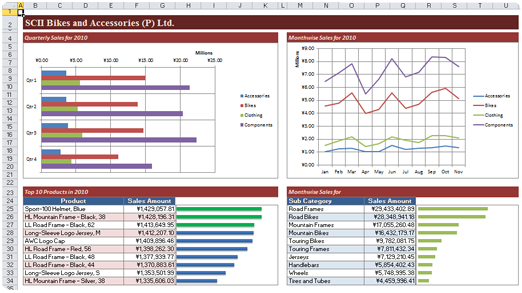
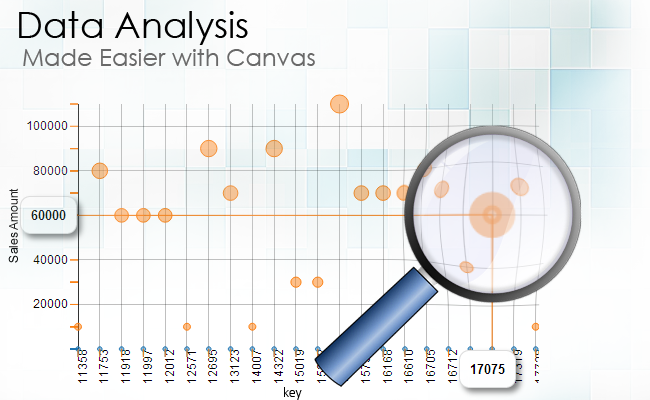
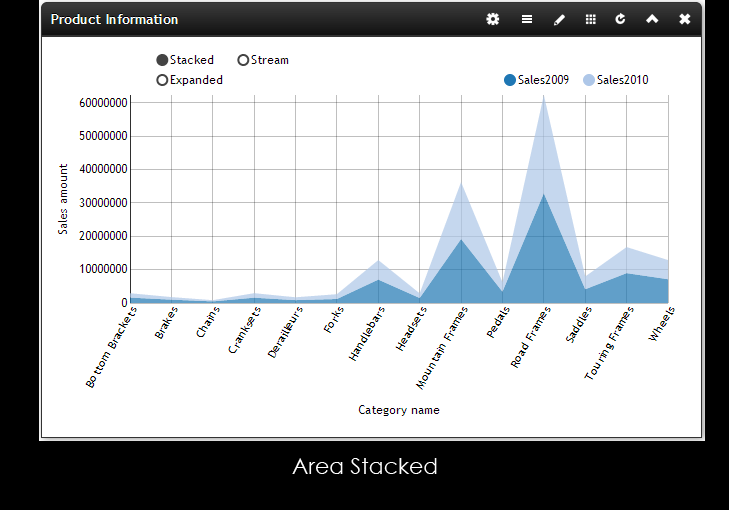
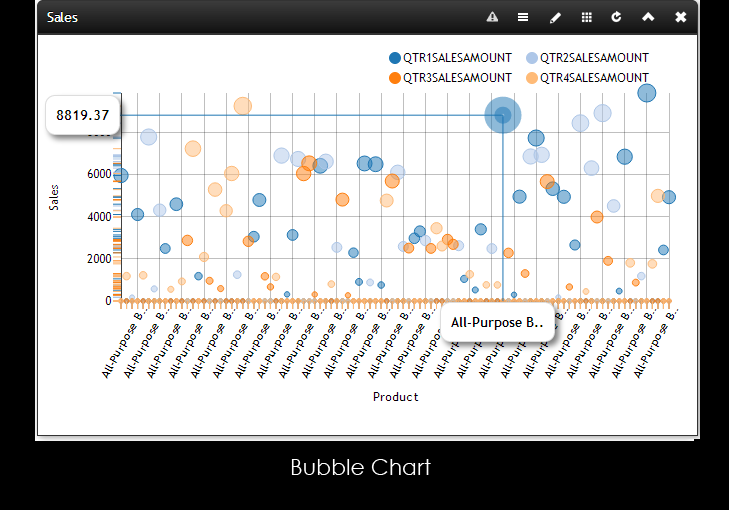
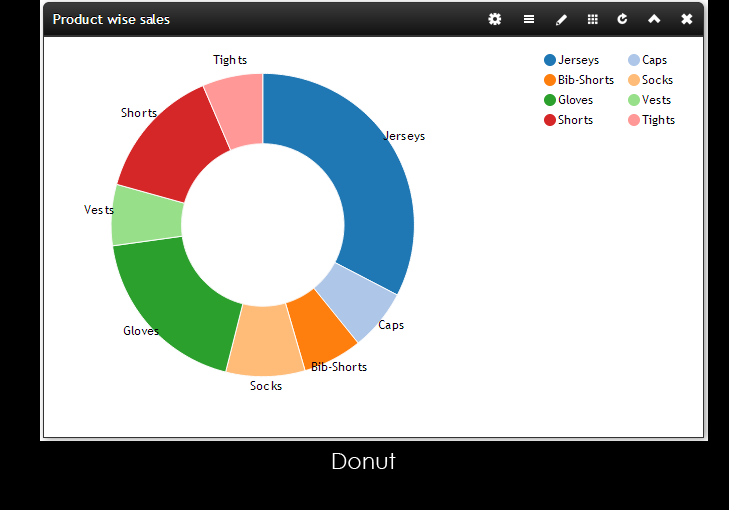
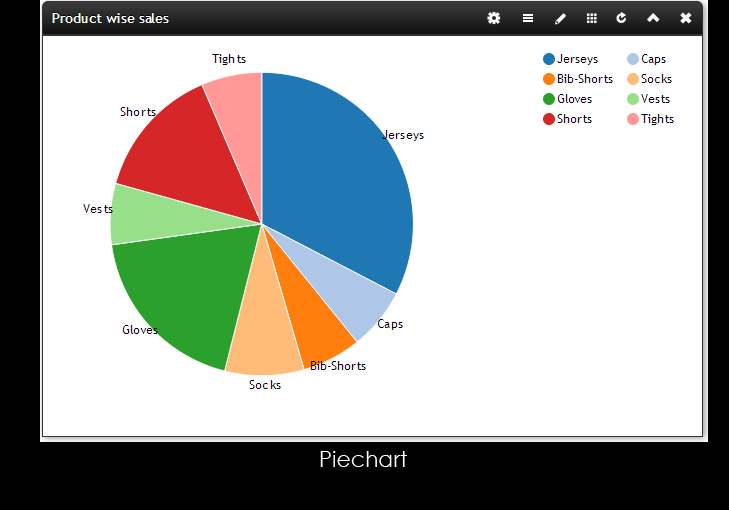
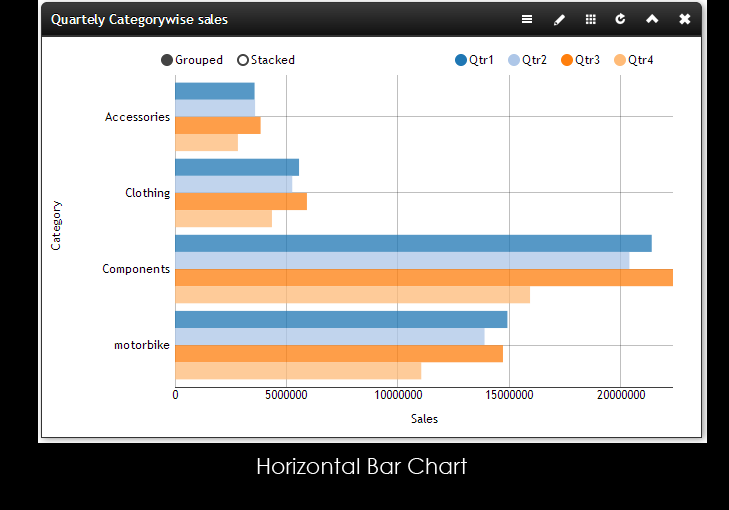
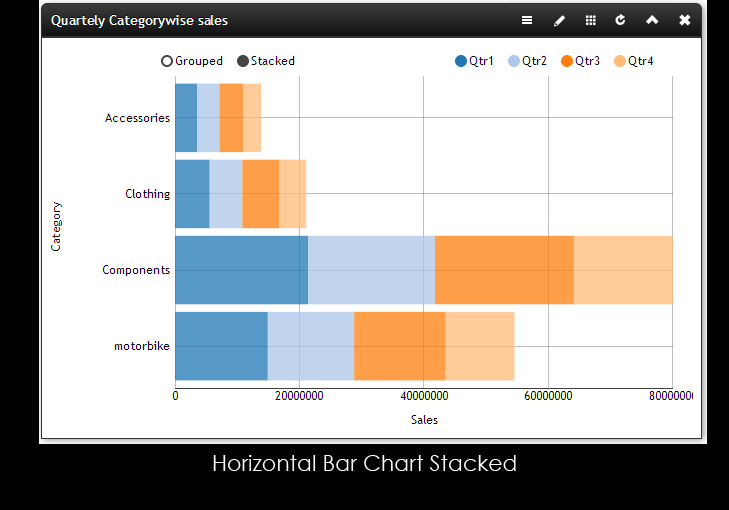
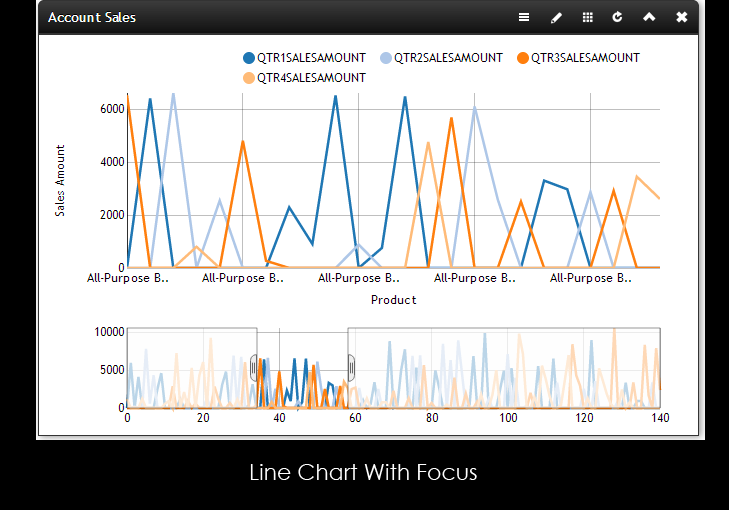
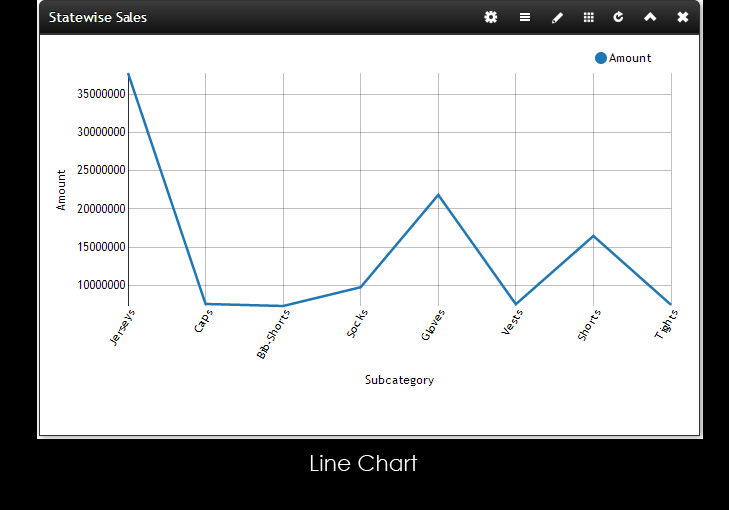
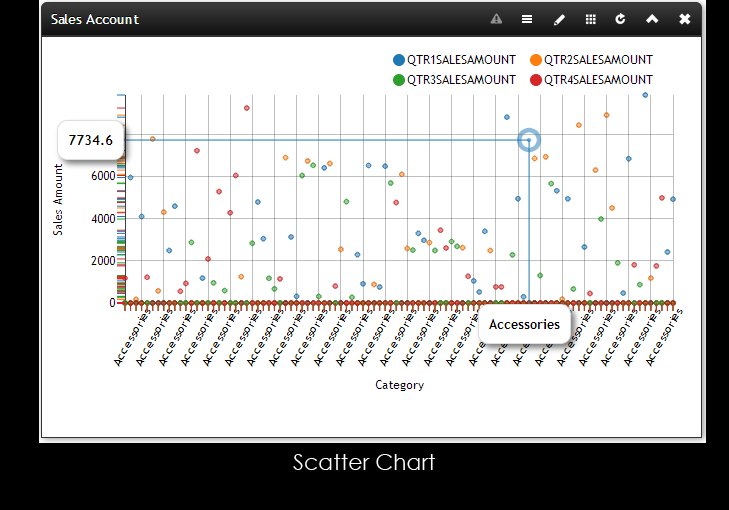
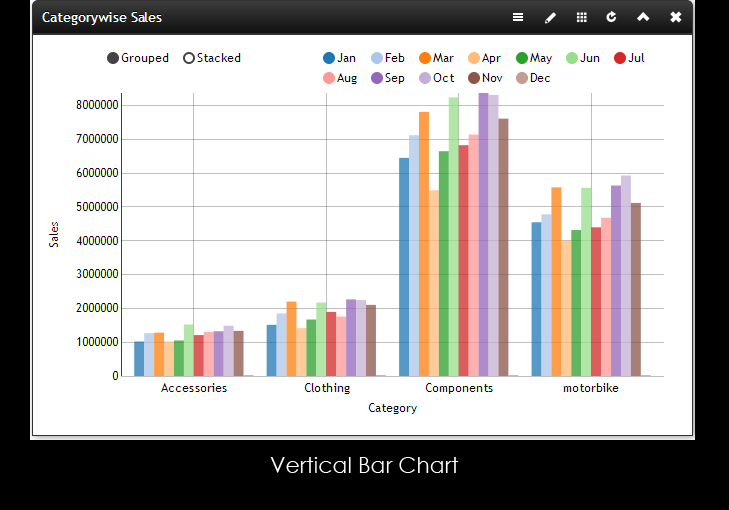
Canvas has many useful analysis functions where data can be grouped, sub totalled, and filtered as required.Canvas dashboards feature shows various interpretations of the data in the form of charts and data grids.

  • Visually analyse and build reports without any technical help in just few mouse clicks that makes the application more interactive.
  • Canvas can produce sophisticated graphics like scatter plots, line charts with focus, bubble charts etc.
  • Save time using the BI services to build new queries or reports, without any help from IT or business analysts.
  • The ability to explore data and create charts or pivot table will change the way you analyse data.
  • Gain insight using analysis functions which include Data grouping, Sorting, Data summarization, Cross tabulation, Subtotals and Cumulative Sub totals, Pivot tables and Charts.
  • Provides Drilldown analysis with Pivot table and charts for efficient analysis of the data.
  • Automate the task of getting regular analytical reports with Templates and Catalogs.

Interactive view

Canvas Dashboard

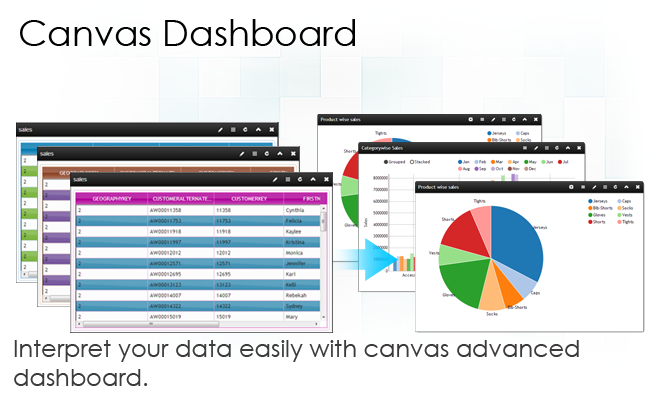
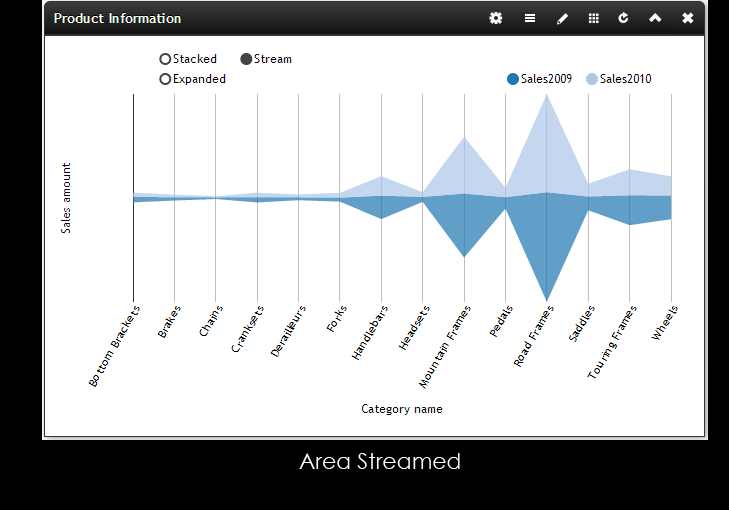
All the data in the world won’t help if it cannot be easily interpreted. Canvas Dashboard provides various styles to represent query templates graphically.

  • Gives visual display of the most important information with respect to one or more objectives on a single screen.
  • Easily access the information needed – either by using existing dashboards or by creating customized dashboards all by yourself, without having to wait for assistance.
  • Helps decision-makers with unique views into the data ensuring that decisions are made based on the complete and up-to-date information.
  • Create insightful dashboard with various charts and tabular view components and share with our colleagues and team members, thus keeping them up-to-date.

Dashboard

Explore Different Types Of Charts And Graphs In Dashboard

Dashboard image tour


Canvas for Everyone

A user friendly design propels Canvas to be used by everyone in a company it can be used by Employees, Managers, Leaders, Management Members and IT Administrators


Product | SCII

Managers

Power Users

Users

Administrators

Managers

  • Complex statistical data is made easily accessible and more readable, keeping in mind the nature of a Manager's work.
  • Get a visual summary of the current information at the finger tips through Dashboard.
  • Analyse the past data through charts to forecast the trend.
  • Identify the problem points with drill down option in Pivot table using Excel worksheets.

Power Users

  • Power Users are those who have administrative powers allowing them compare and utilize data more freely.
  • Create templates and catalogs, using which reports can be generated easily by any user.
  • Consolidate data from different sources (domains) to get the complete picture.
  • Query the database using Query Builder or SQL Editor to get an ad-hoc report.

Users

  • Canvas provides them an elegant interface with which they can perform their tasks quickly and easily.
  • Create reports with data which is directly delivered in to Excel worksheet.
  • Create your own queries using Query Builder to get specific data, even without the knowledge of SQL.

Administrators/IT Department

  • Administrator gives access permissions and restrictions controlling each and every users' authorization through the Canvas Management Tool.
  • Provide access to only specific databases or specific objects of your databases.
  • Be assured of security of the data.
  • Easily manage the application through web based management tool.